


Trade Calculators
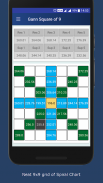
Gann Square of 9 and Pivots
توضیحات Trade Calculators: Gann Square of 9 and Pivots
Whether you are a price action, a pattern, an indicator or whatever trader, ability to identify strong price levels on your charts can greatly improve the quality and profitability of your trading. Instead of taking false signals and wrong trades, the better trades usually happen at key price levels. Those strong areas of interest show that buyers and sellers are concentrating at those levels and they can be the starting or turning points for new price moves and mark new trends as well.
If you are a breakout trader, you need to find areas that can lead to strong breakouts, if you are a trend-following trader you must identify pullback areas or trend continuation points, a reversal trader looks for key turning points and a range trader should focus on well-developed ranges with clearly defined price levels.
Expert analysts or experienced traders always use certain tools and techniques to ascertain support or resistance level, each of which is important because it represents a point at which a major price movement is expected to occur.
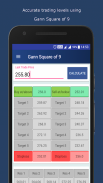
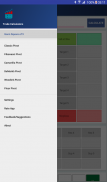
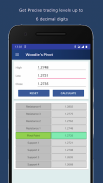
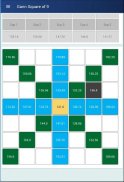
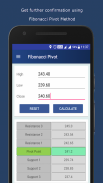
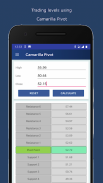
Gann Square of 9 and Pivot Points are hugely popular and used widely. Please use our calculators and precisely determine the trading levels, blend it with technical or other analysis and maximize your profits.
* Our level finding calculators are some great ways to identify areas of support and resistance, but they work best when combined with other kinds of technical analysis
* Trade Calculators is a tool to help you find the levels for support, resistance and targets, however, responsibility for any trades taken based on the levels generated using this tool will solely rely on the user. The developer or the ApverS team will not be held responsible for any losses or gains whatsoever.
* For any Feedback, Suggestions, Bug Reporting, or just to say Hi, please shoot at tradecalc.apvers@gmail.com
Disclosure/Disclaimer
1. This application is only for educational purpose. It uses standard mathematical formulas to determine various support and resistance levels. It does not assure any kind of firm resistance and support values for trading purpose.
2. The user of this application understands the risks involved in trading based on volatility in the market and the universal circumstances. Hence, the User of the application will alone be responsible for trades carried based on levels generated in the application.
3. No legal liability will be taken by the developer in any circumstances for any losses or gains made by using the application.
Tags: Trade Calculators, TradeCalculators, Trading Calculator, Trade, Trading, Calculator, Calculators, Levels, Gann Square Of 9, Pivot Points, Fibonacci Pivot, Camarilla, DeMark's, Woodie's, Floor
این که آیا شما یک عمل قیمت، الگوی، شاخص یا هر معامله گر دیگر هستید، توانایی تعیین قیمت های قوی در نمودارهایتان می تواند کیفیت و سودآوری معاملات شما را بهبود بخشد. به جای گرفتن سیگنال های دروغین و معاملات اشتباه، معاملات بهتر در قیمت های کلیدی اتفاق می افتد. این مناطق با نفوذ قوی نشان می دهد که خریداران و فروشندگان در این سطوح تمرکز می کنند و می توانند نقطه شروع یا چرخش برای حرکت قیمت های جدید باشند و همچنین روند جدید را نیز نشان دهند.
اگر شما یک معامله گر معکوس هستید، باید زمینه هایی پیدا کنید که می تواند به شکست های قوی منجر شود؛ اگر شما یک معامله گر دنباله دار هستید، باید مناطق حقیقی یا نقاط ضعف روند را شناسایی کنید، معامله گر معکوس به دنبال نقاط کلیدی تبدیل می شود و معامله گر باید تمرکز بر محدوده های به خوبی توسعه یافته با سطوح به وضوح مشخص قیمت.
تحلیلگران کارشناس یا معامله گران با تجربه همیشه از ابزار و تکنیک های خاصی برای اطمینان از سطح پشتیبانی یا مقاومت استفاده می کنند که هر کدام مهم هستند زیرا نشان دهنده نقطه ای است که انتظار می رود حرکت اصلی قیمت رخ دهد.
میدان Gann از 9 و نقاط محوری بسیار محبوب هستند و به طور گسترده ای استفاده می شود. لطفا از ماشین حساب ما استفاده کنید و دقیقا سطح معاملات را تعیین کنید، آن را با تجزیه و تحلیل فنی یا دیگر ترکیب کنید و سود خود را به حداکثر برسانید.
* ماشین حساب های ما برای پیدا کردن سطح ما راه هایی عالی برای شناسایی مناطق حمایتی و مقاومت است، اما بهترین کار آنها در مقایسه با انواع دیگر تحلیل فنی
* تجارت ماشین حساب یک ابزار برای کمک به شما در پیدا کردن سطوح برای حمایت، مقاومت و اهداف است، با این حال، مسئولیت هر گونه معاملات بر اساس سطوح تولید شده با استفاده از این ابزار تنها به کاربر تکیه می کنند. توسعه دهنده یا تیم ApverS مسئول هیچگونه زیان یا دستاورد دیگری نخواهد بود.
* برای هر گونه بازخورد، پیشنهادات، گزارش اشکال، و یا فقط به سلام، لطفا در tradecalc.apvers@gmail.com ساقه
افشای / سلب مسئولیت
1. این نرم افزار فقط برای هدف آموزشی است. از فرمول های ریاضی استاندارد برای تعیین سطوح پشتیبانی و مقاومت مختلف استفاده می کند. این هیچ گونه مقاومت مقاومت و ارزش های حمایت برای هدف تجاری را تضمین نمی کند.
2. کاربر این نرم افزار درک خطرات مربوط به تجارت بر اساس نوسانات در بازار و شرایط جهانی است. از این رو، کاربر نرم افزار تنها مسئول فروش معاملات بر اساس سطوح تولید شده در برنامه می باشد.
3. در هر شرایطی هیچ مشکلی قانونی برای هرگونه زیان یا سود حاصل از استفاده از نرم افزار ایجاد نخواهد شد.
برچسب ها: تجارت ماشین حساب، TradeCalculators، ماشین حساب تجارت، تجارت، تجارت، ماشین حساب، ماشین حساب، سطوح، میدان Gann از 9، نقطه محوری، فیبوناچی محور، Camarilla، DeMark، وودی، طبقه
Trade Calculators : Gann Square of 9 and Pivots - نسخه 1.2.1
(14-03-2020)Trade Calculators: Gann Square of 9 and Pivots - اطلاعات APK
نسخه APK: 1.2.1حزمة: com.apvers.tradecalculatorsآخرین نسخه Trade Calculators : Gann Square of 9 and Pivots


 4.83
4.83


اپلیکیشنها در دسته مشابه


